#!/bin/bash

declare -A USE_MAP
declare -a ENABLES

# export_name dependency dependecy dependency...
USE_MAP['HBASE']='USE_HBASE HCATALOG HUE'
USE_MAP['PIG']='USE_PIG'
USE_MAP['HUE']='USE_HUE'
USE_MAP['HCATALOG']='USE_HCATALOG'
USE_MAP['PRESTO']='USE_PRESTO HCATALOG'
ENABLES=()

function use() {
  local dep=(${USE_MAP["$1"]})
  ENABLES+=(${dep[0]})
  dep=("${dep[@]:1}")
  if [ ! -z "$dep" ]; then
    for item in ${dep[@]}; do
      use $item
    done
  fi
}

function export_enabled() {
  sorted_use=($(echo "${ENABLES[@]}" | tr ' ' '\n' | sort -u | tr '\n' ' '))
  for item in ${sorted_use[@]}; do
    echo "export $item";
  done
}

use HBASE
export_enabled

------

$ bash resolve.sh
export USE_HBASE
export USE_HCATALOG
export USE_HUECategory: unix
Ambari – user can log in but has no privileges
We ran into some interesting issue – user has all the privileges, was in correct ldap group, can log in to the ambari, but privileges weren’t effective.
I did multiple discoveries – checked log ambari-server.log and found out following
com.google.common.cache.CacheLoader$InvalidCacheLoadException: CacheLoader returned null for key myuser.So, tried to restart ambari-server, didn’t work. Did further investigation, using ambari API
$ curl -XGET -H"X-Requested-By: ambari" -u admin:... https://ambari.mycluster.com/api/v1/users/myuser
{
  "href" : "http://ambari.mycluster.com/api/v1/users/myuser",
  "Users" : {
    "active" : true,
    "admin" : false,
    "groups" : [
      "ldap-users",
      "cluster-admins"
    ],
    "ldap_user" : false,
    "user_name" : "MYUSER",
    "user_type" : "PAM"
  },
so, this worked. Notice uppercase in user_name. So I tried to fetch user info with privileges
$ curl -XGET -H"X-Requested-By: ambari" -u admin:... https://ambari.mycluster.com/api/v1/users/myuser?fields=privileges/*
{
  "href" : "http://ambari.mycluster.com/api/v1/users/myuser?fields=privileges/*",
  "Users" : {
    "user_name" : "MYUSER"
  },
  "privileges" : [
    {
      "href" : "http://ambari.mycluster.com/api/v1/users/myuser/privileges/153",
      "PrivilegeInfo" : {
        "instance_name" : "INSTANCE",
        "permission_label" : "View User",
        "permission_name" : "VIEW.USER",
        "principal_name" : "cluster-admins",
        "principal_type" : "GROUP",
        "privilege_id" : 153,
        "type" : "VIEW",
        "user_name" : "MYUSER",
        "version" : "2.4.3.0",
        "view_name" : "ADMIN_VIEW"
      }
    },
Nice. Works too. So another check – load only certain privileges – 153.
$ curl -XGET -H"X-Requested-By: ambari" -u admin:... https://ambari.mycluster.com/api/v1/users/myuser/privileges/153
{
  "status": 500,
  "message": "Server Error"
}

and even upcase

$ curl -XGET -H"X-Requested-By: ambari" -u admin:... https://ambari.mycluster.com/api/v1/users/MYUSER/privileges/153
{
  "status": 500,
  "message": "Server Error"
}
Aha! Looks like there’s some inconsitency in the postgres database. So, check it!
ambari=> select * from users where user_name='myuser';
 user_id | principal_id | ldap_user | user_name | create_time | user_password | active | active_widget_layouts | user_type
---------+--------------+-----------+-----------+-------------+---------------+--------+-----------------------+-----------
(0 rows)

ambari=> select * from users where user_name='MYUSER';
 user_id | principal_id | ldap_user | user_name |      create_time       | user_password | active | active_widget_layouts | user_type
---------+--------------+-----------+-----------+------------------------+---------------+--------+-----------------------+-----------
   16005 |        20005 |         0 | MYUSER  | 2019-11-22 04:37:44.18 |               |      1 | [{"id":"29405"}]      | PAM
(1 row)
Gotcha. There’s no such user named myuser in the database – and pg is case sensitive. So, rename the user
ambari=> update users set user_name='myuser' where user_id=16005;
UPDATE 1
ambari=> \q
and restart ambari-server. Now we can try again the api call
$ curl -XGET -H"X-Requested-By: ambari" -u admin:... https://ambari.mycluster.com/api/v1/users/myuser/privileges/153
{
  "href" : "http://ambari.mycluster.com/api/v1/users/myuser/privileges/153",
  "PrivilegeInfo" : {
    "instance_name" : "INSTANCE",
    "permission_label" : "View User",
    "permission_name" : "VIEW.USER",
    "principal_name" : "cluster-admins",
    "principal_type" : "GROUP",
    "privilege_id" : 153,
    "type" : "VIEW",
    "user_name" : "myuser",
    "version" : "2.4.3.0",
    "view_name" : "ADMIN_VIEW"
  }
}
Voila!
Side by side images
Quick script. As I’ve got FLIR images of my house, I wanted to have them side by side – original image + FLIR. So I wrote some small (fast) script in bash to do that.
#!/bin/bash

ir=IR_
img=DC_

im_start=$1
ir_start=$((im_start-1))

echo "Starting from $start - $(printf "%s%04d.jpg" $img $im_start)"
echo "IR will be from $ir_start - $(printf "%s%04d.jpg" $ir $ir_start)"

if [[ ! -f "$(printf "%s%04d.jpg" $img $im_start)" ]]; then
  echo "Image doesn't exist!"
  exit
fi

if [[ ! -f "$(printf "%s%04d.jpg" $ir $ir_start)" ]]; then
  echo "IR doesn't exist!"
  exit
fi

loop=1

while [ $loop -ne 0 ];do

  image=$(printf "%s%04d.jpg" $img $im_start)
  ir_image=$(printf "%s%04d.jpg" $ir $ir_start)

  combined_image=$(printf "flir-%04d-%04d.jpg" $im_start $ir_start)

  echo -n "$image + $ir_image --> $combined"
  montage -mode concatenate -tile x1 $image $ir_image $combined_image
  echo "..Done!"

  # increase
  im_start=$((im_start+2))
  ir_start=$((ir_start+2))

  #echo "Next file $(printf "%s%04d.jpg" $img $im_start)"

  # test if file?
  if [[ ! -f "$(printf "%s%04d.jpg" $img $im_start)" ]]; then
    loop=0
  fi
done
And the resulting image:

sidekiq getting stuck?
We had quite strange scenario. Two hosts with sidekiq, one working well, second one gets stuck after few seconds or minutes. Happened in workers with opening new TCP/UDP connections. So, I started to review all the files, where ‘max files’ is set.
$ cat /etc/security/limits.conf
* soft nofile 30000
* hard nofile 60000

tom@web:~$ ulimit -Hn
60000
tom@web:~$ ulimit -Sn
30000

tom@web:~$ /sbin/sysctl -a | grep "file-max"
fs.file-max = 60000
So, all this looks OK so far. After numerous checks I’ve found, that our eye process is running for a while, maybe since the beginning and probably it took old file-max settings. How to check? Simply run eye info or get PID of the sidekiq process and run following command (assume 22613 is the PID):
tom@web:~$ cat /proc/22613/limits
Limit                     Soft Limit           Hard Limit           Units
Max cpu time              unlimited            unlimited            seconds
Max file size             unlimited            unlimited            bytes
Max data size             unlimited            unlimited            bytes
Max stack size            8388608              unlimited            bytes
Max core file size        0                    unlimited            bytes
Max resident set          unlimited            unlimited            bytes
Max processes             516140               516140               processes
Max open files            1024                 4096                 files
Max locked memory         65536                65536                bytes
Max address space         unlimited            unlimited            bytes
Max file locks            unlimited            unlimited            locks
Max pending signals       516140               516140               signals
Max msgqueue size         819200               819200               bytes
Max nice priority         0                    0
Max realtime priority     0                    0
Max realtime timeout      unlimited            unlimited            us
Gotcha! 1024 as soft-limit, 4096 hard limit. The fix is pretty simple – just quit eye , load it’s config and restart sidekiq.
tom@web:~$ eye quit
quit...

tom@web:~$ eye load config.eye
eye started!
config loaded!

tom@web~$ eye restart sidekiq

tom@web:~$ cat /proc/4624/limits
Limit                     Soft Limit           Hard Limit           Units
Max cpu time              unlimited            unlimited            seconds
Max file size             unlimited            unlimited            bytes
Max data size             unlimited            unlimited            bytes
Max stack size            8388608              unlimited            bytes
Max core file size        0                    unlimited            bytes
Max resident set          unlimited            unlimited            bytes
Max processes             516140               516140               processes
Max open files            30000                60000                files
Max locked memory         65536                65536                bytes
Max address space         unlimited            unlimited            bytes
Max file locks            unlimited            unlimited            locks
Max pending signals       516140               516140               signals
Max msgqueue size         819200               819200               bytes
Max nice priority         0                    0
Max realtime priority     0                    0
Max realtime timeout      unlimited            unlimited            us
voila! We’re back on track :)
sendmail + osx 10.10.4/ios 8.4/ios 9
After upgrade I was unable se to send mails through my sendmail, from both OSX 10.10.4 and upgraded iOS9 …
this was in my sendmail log:
Jul 12 19:58:03 orin sendmail[12164]: STARTTLS=server, error: accept failed=0, SSL_error=1, errno=0, retry=-1
Jul 12 19:58:03 orin sendmail[12164]: STARTTLS=server: 12164:error:14094410:SSL routines:SSL3_READ_BYTES:sslv3 alert handsh
ake failure:s3_pkt.c:1053:SSL alert number 40
fix is amazingly easy and effective:
generate dh2048 certificate:
openssl gendh -out dh_2048.pem -2 2048
and add to sendmail.mc:
define(`confDH_PARAMETERS',`/etc/mail/certs/dh_2048.pem')
then recompile your .mc and restart sendmail.
Optimizing fluentd
We’re currently using (for one part of our infrastructure) logging into elasticsearch. We have fluentd collectors and kibana interface for viewing and searching through the logs. 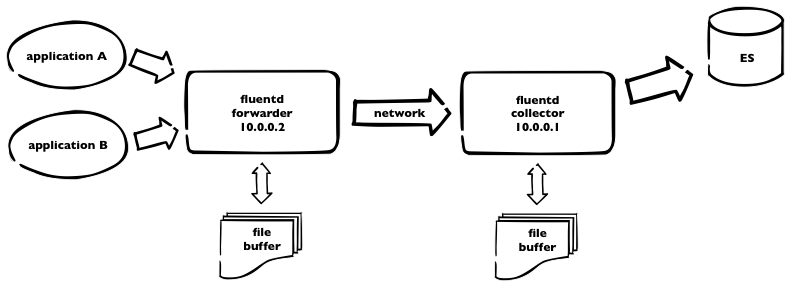 This is how it works. Logs are sent to fluentd forwarder and then over the network to fluentd collector, which pushes all the logs to elasticsearch. As we have plenty of logs, we need to incorporate some buffering – on both sides – using buffer_file statement in the fluentd config. Here is a part of our fluentd config from forwarder
<match ***>
  type forward
  send_timeout 60s
  recover_wait 10s
  heartbeat_interval 1s
  phi_threshold 16
  hard_timeout 120s

  # buffer
  buffer_type file
  buffer_path /opt/fluentd/buffer/
  buffer_chunk_limit 8m
  buffer_queue_limit 4096
  flush_interval 10s
  retry_wait 20s

  # log to es
  <server>
    host 10.0.0.1
  </server>
  <secondary>
    type file
    path /opt/fluentd/failed/
  </secondary>
</match>
and the same for the collector
<source>
  type forward
  bind 10.0.0.1
</source>

<match log.**>
  type elasticsearch
  logstash_format true
  # elastic host
  host 10.0.0.3
  port 9200
  logstash_prefix log
  include_tag_key

  # buffering
  buffer_type file
  buffer_path /opt/fluentd/buffer/
  flush_interval 5m
  buffer_chunk_limit 16m
  buffer_queue_limit 4096
  retry_wait 15s
</match>
So. For the forwarder, we’re using buffer with max 4096 8MB chunks = 32GB of buffer space. Forwarder is flushing every 10secs. For collector, we use bigger chunks, as elasticsearch is capable to handle it – but not using default 256MB chunks due to memory limitations. Flushing period is longer – and should be – recommended value is 5minutes. We can keep up to 64Gigs of buffer data.
What happens if one of the fluentd dies. Some data will be probably lost, when unsaved to buffer. But. When there’s connection lost or collector fluentd isn’t running, all logs, collected by forwarder, are stored into the buffer – and sent later. Which is great. The same when ES is down for some reason, collector node is still receiving data and is able to continue sending into ES after full recovery.
PS: don’t forget to make some tweaks to the system itself, like raise the limit for max files opened and some tcp tunning.
Securing kibana + elasticsearch
After some successful setup of Kibana + es for fluentd there’s a need to secure whole website. So I decided to use nginx and basic auth. I assume you have standard configuration – with es running on localhost:9200.
# htpasswd -c /opt/nginx/conf/.htpasswd some_user
and now modify nginx config:
#user  nobody;
#group nogroup;
worker_processes  5;

events {
    worker_connections  1024;
}

http {
    include       mime.types;
    default_type  application/octet-stream;

    log_format  main  '$remote_addr - $remote_user [$time_local] "$request" '
                      '$status $body_bytes_sent "$http_referer" '
                      '"$http_user_agent" "$http_x_forwarded_for"';

    sendfile        on;
    keepalive_timeout  65;

    gzip  on;

    server {
        # we listen on :8080
        listen       8080;
        server_name  somer.server;

        charset utf-8;

        access_log  logs/host.access.log  main;

        # root for Kibana installation
        location / {
	    auth_basic "Restricted";
            auth_basic_user_file /opt/nginx/conf/.htpasswd;
            root   /opt/kibana;
            index  index.html index.htm;
        }

        # and for elasticsearch
        location /es {
	    auth_basic "Restricted - ES";
            auth_basic_user_file /opt/nginx/conf/.htpasswd;

            rewrite ^/es/_aliases$ /_aliases break;
            rewrite ^/es/_nodes$ /_nodes break;
            rewrite ^/es/(.*/_search)$ /$1 break;
            rewrite ^/es/(.*/_mapping)$ /$1 break;
            rewrite ^/es/(.*/_aliases)$ /$1 break;
            rewrite ^/es/(kibana-int/.*)$ /$1 break;
            return 403;

            # set some headers
            proxy_http_version 1.1;
            proxy_set_header  X-Real-IP  $remote_addr;
            proxy_set_header  X-Forwarded-For $proxy_add_x_forwarded_for;
            proxy_set_header  Host $http_host;

            proxy_pass http://localhost:9200;
        }

        error_page   500 502 503 504  /50x.html;
        location = /50x.html {
            root   html;
        }
    }
}
Duplicity – BackendException: ssh connection to server:22 failed: Unknown server
Booom! After reinstall of one of our servers I got into this. Weird error. It’s caused by paramiko. There’s no code fix available, but reason is simple – and fix too.
Connect to your box, and simply remove two files from /etc/ssh directory
root@limone:/# ls -la /etc/ssh/
total 168
drwxr-xr-x  2 root root   4096 Apr 24 15:31 .
drwxr-xr-x 82 root root   4096 Apr 24 16:00 ..
-rw-r--r--  1 root root 136156 Feb  8  2013 moduli
-rw-r--r--  1 root root   1669 Feb  8  2013 ssh_config
-rw-------  1 root root    668 Apr 23 12:05 ssh_host_dsa_key
-rw-r--r--  1 root root    601 Apr 23 12:05 ssh_host_dsa_key.pub
-rw-------  1 root root    227 Apr 23 12:05 ssh_host_ecdsa_key
-rw-r--r--  1 root root    173 Apr 23 12:05 ssh_host_ecdsa_key.pub
-rw-------  1 root root   1675 Apr 23 12:05 ssh_host_rsa_key
-rw-r--r--  1 root root    393 Apr 23 12:05 ssh_host_rsa_key.pub
-rw-r--r--  1 root root   2510 Apr 23 12:15 sshd_config
so, remove these two files:
-rw-------  1 root root  227 Apr 23 12:05 ssh_host_ecdsa_key
-rw-r--r--  1 root root  173 Apr 23 12:05 ssh_host_ecdsa_key.pub
Then clean up ~/.ssh/known_hosts file on the box your’re running backup from
ssh-keygen -f "/root/.ssh/known_hosts" -R server_fqdn
ssh-keygen -f "/root/.ssh/known_hosts" -R server_ip
connect using ssh to backup server from that host (to write id_rsa keys into known_hosts file)
# ssh root@server_fqdn
Warning: the RSA host key for 'server_fqdn' differs from the key for the IP address 'server_ip'
Offending key for IP in /root/.ssh/known_hosts:3
Matching host key in /root/.ssh/known_hosts:11
Are you sure you want to continue connecting (yes/no)? yes
root@server_fqdn's password:
and run duplicate again.
voila! :)
redis sentinel setup
Prerequisities
- multiple clients with redis 2.8.2+ installed
Do I need sentinel? If you want to have some kind of redis failover (there’s no cluster yet) – yes. Sentinels continuously monitor every redis instance and change configuration of given redis node(s) – if specified number of sentinels decided whether master is down, then they elect and promote new master and set other nodes as a slave of this master.
Looks interesting? Yes. It is. But. There’s a little time gap between electing and switching to the new master. You have to resolve this on application level.
Basically. Initial setup expects all nodes running as a master, with manual set slaveof ip port in redis-cli on meaned redis slaves. Then run sentinel and it does the rest.
sample redis configururation files follow:
daemonize yes
pidfile /usr/local/var/run/redis-master.pid
port 6379
bind 10.0.0.1
timeout 0
loglevel notice
logfile /opt/redis/redis.log
databases 1
save 900 1
save 300 10
save 60 10000
stop-writes-on-bgsave-error yes
rdbcompression yes
rdbchecksum yes
dbfilename master.rdb

dir /usr/local/var/db/redis/
slave-serve-stale-data yes
slave-read-only no
slave-priority 100
maxclients 2048
maxmemory 256mb

# act as binary log with transactions
appendonly yes

appendfsync everysec
no-appendfsync-on-rewrite no
auto-aof-rewrite-percentage 100
auto-aof-rewrite-min-size 64mb
lua-time-limit 5000
slowlog-log-slower-than 10000
slowlog-max-len 128
hash-max-ziplist-entries 512
hash-max-ziplist-value 64
list-max-ziplist-entries 512
list-max-ziplist-value 64
set-max-intset-entries 512
zset-max-ziplist-entries 128
zset-max-ziplist-value 64
activerehashing yes

client-output-buffer-limit normal 0 0 0
client-output-buffer-limit slave 256mb 64mb 60
client-output-buffer-limit pubsub 32mb 8mb 60
and sentinel configuration file:
port 17700
daemonize yes
logfile "/opt/redis/sentinel.log"

sentinel monitor master 10.0.0.1 6379 2
sentinel down-after-milliseconds master 4000
sentinel failover-timeout master 180000
sentinel parallel-syncs master 4
Start all of your redis nodes with redis config and choose master. Then run redis console and set all other nodes as a slave of given master, using command slaveof 10.0.0.1 6379. Then you can connect to your master and verify, if there are all of your slave nodes, connected and syncing – run info command in your master redis console. Output should show you something like this
- snip -

# Replication
role:master
connected_slaves:3
slave0:ip=10.0.0.2,port=6379,state=online,offset=17367254333,lag=1
slave1:ip=10.0.0.3,port=6379,state=online,offset=17367242971,lag=1
slave2:ip=10.0.0.4,port=6379,state=online,offset=17367222381,lag=1

- snip-
To test, if your sentinel works, just shutdown your redis master and watch sentinel log. You should see something like this
[17240] 04 Dec 07:56:16.289 # +sdown master master 10.24.37.144 6379
[17240] 04 Dec 07:56:16.551 # +new-epoch 1386165365
[17240] 04 Dec 07:56:16.551 # +vote-for-leader 185301a20bdfdf1d5316f95bae0fe1eb544edc58 1386165365
[17240] 04 Dec 07:56:17.442 # +odown master master 10.0.0.1 6379 #quorum 4/2
[17240] 04 Dec 07:56:18.489 # +switch-master master 10.0.0.1 6379 10.0.0.2 6379
[17240] 04 Dec 07:56:18.489 * +slave slave 10.0.0.3:6379 10.0.0.3 6379 @ master 10.0.0.2 6379
[17240] 04 Dec 07:56:18.490 * +slave slave 10.0.0.4:6379 10.0.0.4 6379 @ master 10.0.0.2 6379
[17240] 04 Dec 07:56:28.680 * +convert-to-slave slave 10.0.0.1:6379 10.0.0.1 6379 @ master 10.0.0.2 6379
explained line by line
+sdown master master 10.24.37.144 6379
master is subjectively down (maybe)
+odown master master 10.0.0.1 6379 #quorum 4/2
master is objectively down (oh, really), two of four sentinels have the same opinion
+switch-master master 10.0.0.1 6379 10.0.0.2 6379
so we switch to another master – chosen 10.0.0.2
+slave slave 10.0.0.3:6379 10.0.0.3 6379 @ master 10.0.0.2 6379
reconfigure 10.0.0.3 as a slave of new master 10.0.0.2
+convert-to-slave slave 10.0.0.1:6379 10.0.0.1 6379 @ master 10.0.0.2 6379
sorry, former master, you have to serve as a slave now
+sdown, -odown? + means ‘is’, – means ‘is no longer’. Then “+sdown” can be translated as “is subjectively down” and “-odown” like “is no longer objectively down”. Simple, huh? :)
PS: take my configuration files as a sample. Feel free to modify to match your need and check redis/sentinel configuration docs to get deeper knowledge about configuration options.
rails + passenger + nginx maintenance mode
I need to add maintenance page to some rails app, running with passenger and nginx. Here’s some config and steps.
You just need to add static html file to app_root/public/maintenance.html – and I assume css files on /assets url.
so, here’s nginx config:
server {
  listen 80;
  server_name = www.example.com;
  root /home/deploy/www.example.com/public;
  passenger_enabled on;
  passenger_min_instances 5;

  set $maintenance 0;

  # is there maintenance file set?
  if (-f $document_root/../tmp/maintenance.txt) {
    set $maintenance 1;
  }

  # exclude /assets
  if ( $uri ~* ^/assets\/\.* ) {
    set $maintenance 0;
  }

  # in maintenance mode - send 503 status
  if ($maintenance = 1) {
    return 503;
  }

  # maintenance mode
  error_page 503 @503;

  # rewrite everything to maintenance.html
  location @503 {
    rewrite ^ /maintenance.html last;
    break;
  }
}
setting maintance mode is really simple – set app_root/tmp/maintenance.txt file – when escaping, just remove that file.