Optimizing fluentd

We’re currently using (for one part of our infrastructure) logging into elasticsearch. We have fluentd collectors and kibana interface for viewing and searching through the logs. fluentd 
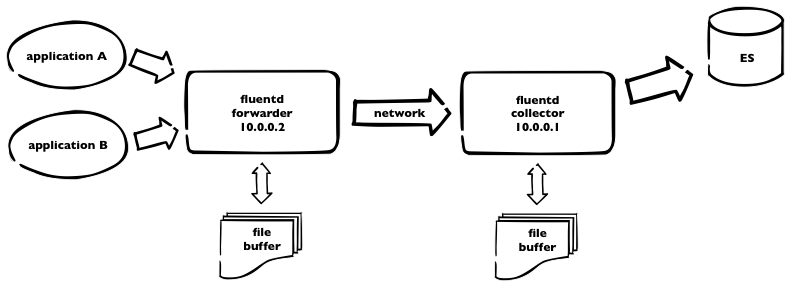
This is how it works. Logs are sent to fluentd forwarder and then over the network to fluentd collector, which pushes all the logs to elasticsearch. As we have plenty of logs, we need to incorporate some buffering – on both sides – using buffer_file statement in the fluentd config. Here is a part of our fluentd config from forwarder

<match ***>
  type forward
  send_timeout 60s
  recover_wait 10s
  heartbeat_interval 1s
  phi_threshold 16
  hard_timeout 120s

  # buffer
  buffer_type file
  buffer_path /opt/fluentd/buffer/
  buffer_chunk_limit 8m
  buffer_queue_limit 4096
  flush_interval 10s
  retry_wait 20s

  # log to es
  <server>
    host 10.0.0.1
  </server>
  <secondary>
    type file
    path /opt/fluentd/failed/
  </secondary>
</match>

and the same for the collector

<source>
  type forward
  bind 10.0.0.1
</source>

<match log.**>
  type elasticsearch
  logstash_format true
  # elastic host
  host 10.0.0.3
  port 9200
  logstash_prefix log
  include_tag_key

  # buffering
  buffer_type file
  buffer_path /opt/fluentd/buffer/
  flush_interval 5m
  buffer_chunk_limit 16m
  buffer_queue_limit 4096
  retry_wait 15s
</match>

So. For the forwarder, we’re using buffer with max 4096 8MB chunks = 32GB of buffer space. Forwarder is flushing every 10secs. For collector, we use bigger chunks, as elasticsearch is capable to handle it – but not using default 256MB chunks due to memory limitations. Flushing period is longer – and should be – recommended value is 5minutes. We can keep up to 64Gigs of buffer data.

What happens if one of the fluentd dies. Some data will be probably lost, when unsaved to buffer. But. When there’s connection lost or collector fluentd isn’t running, all logs, collected by forwarder, are stored into the buffer – and sent later. Which is great. The same when ES is down for some reason, collector node is still receiving data and is able to continue sending into ES after full recovery.

PS: don’t forget to make some tweaks to the system itself, like raise the limit for max files opened and some tcp tunning.

Securing kibana + elasticsearch

After some successful setup of Kibana + es for fluentd there’s a need to secure whole website. So I decided to use nginx and basic auth. I assume you have standard configuration – with es running on localhost:9200.

# htpasswd -c /opt/nginx/conf/.htpasswd some_user

and now modify nginx config:

#user  nobody;
#group nogroup;
worker_processes  5;

events {
    worker_connections  1024;
}

http {
    include       mime.types;
    default_type  application/octet-stream;

    log_format  main  '$remote_addr - $remote_user [$time_local] "$request" '
                      '$status $body_bytes_sent "$http_referer" '
                      '"$http_user_agent" "$http_x_forwarded_for"';

    sendfile        on;
    keepalive_timeout  65;

    gzip  on;

    server {
        # we listen on :8080
        listen       8080;
        server_name  somer.server;

        charset utf-8;

        access_log  logs/host.access.log  main;

        # root for Kibana installation
        location / {
	    auth_basic "Restricted";
            auth_basic_user_file /opt/nginx/conf/.htpasswd;
            root   /opt/kibana;
            index  index.html index.htm;
        }

        # and for elasticsearch
        location /es {
	    auth_basic "Restricted - ES";
            auth_basic_user_file /opt/nginx/conf/.htpasswd;

            rewrite ^/es/_aliases$ /_aliases break;
            rewrite ^/es/_nodes$ /_nodes break;
            rewrite ^/es/(.*/_search)$ /$1 break;
            rewrite ^/es/(.*/_mapping)$ /$1 break;
            rewrite ^/es/(.*/_aliases)$ /$1 break;
            rewrite ^/es/(kibana-int/.*)$ /$1 break;
            return 403;

            # set some headers
            proxy_http_version 1.1;
            proxy_set_header  X-Real-IP  $remote_addr;
            proxy_set_header  X-Forwarded-For $proxy_add_x_forwarded_for;
            proxy_set_header  Host $http_host;

            proxy_pass http://localhost:9200;
        }

        error_page   500 502 503 504  /50x.html;
        location = /50x.html {
            root   html;
        }
    }
}

Duplicity – BackendException: ssh connection to server:22 failed: Unknown server

Booom! After reinstall of one of our servers I got into this. Weird error. It’s caused by paramiko. There’s no code fix available, but reason is simple – and fix too.

Connect to your box, and simply remove two files from /etc/ssh directory

root@limone:/# ls -la /etc/ssh/
total 168
drwxr-xr-x  2 root root   4096 Apr 24 15:31 .
drwxr-xr-x 82 root root   4096 Apr 24 16:00 ..
-rw-r--r--  1 root root 136156 Feb  8  2013 moduli
-rw-r--r--  1 root root   1669 Feb  8  2013 ssh_config
-rw-------  1 root root    668 Apr 23 12:05 ssh_host_dsa_key
-rw-r--r--  1 root root    601 Apr 23 12:05 ssh_host_dsa_key.pub
-rw-------  1 root root    227 Apr 23 12:05 ssh_host_ecdsa_key
-rw-r--r--  1 root root    173 Apr 23 12:05 ssh_host_ecdsa_key.pub
-rw-------  1 root root   1675 Apr 23 12:05 ssh_host_rsa_key
-rw-r--r--  1 root root    393 Apr 23 12:05 ssh_host_rsa_key.pub
-rw-r--r--  1 root root   2510 Apr 23 12:15 sshd_config

so, remove these two files:

-rw-------  1 root root  227 Apr 23 12:05 ssh_host_ecdsa_key
-rw-r--r--  1 root root  173 Apr 23 12:05 ssh_host_ecdsa_key.pub

Then clean up ~/.ssh/known_hosts  file on the box your’re running backup from

ssh-keygen -f "/root/.ssh/known_hosts" -R server_fqdn
ssh-keygen -f "/root/.ssh/known_hosts" -R server_ip

connect using ssh to backup server from that host (to write id_rsa keys into known_hosts file)

# ssh root@server_fqdn
Warning: the RSA host key for 'server_fqdn' differs from the key for the IP address 'server_ip'
Offending key for IP in /root/.ssh/known_hosts:3
Matching host key in /root/.ssh/known_hosts:11
Are you sure you want to continue connecting (yes/no)? yes
root@server_fqdn's password:

and run duplicate again.

voila! :)

1. Dort – WIP

Korpus I – kakaový

  • 270g hladké mouky (5.10 Kč)
  • 100ml vlažné vody (..)
  • 150ml oleje (6 Kč)
  • 250g cukr moučka (6.50 Kč)
  • 10g prášku do pečiva (5 Kč)
  • 5 vajec (12 Kč)
  • 2-3 lžíce pravého kakaa ( ..)

Bílky vyšlehat na sníh, cukr utřít se žloutky, přidat zbytek. Pečeme při 160oC cca hodinu (3,5kW – cca 10Kč). Aby dort byl plochý, můžeme překlopit vzhůru nohama na podložku.

Čas přípravy – 30min (50Kč), cena za korpus – 44,60 + 50Kč = 94,60 Kč

Korpus II – oříškový

  • lískové ořechy, 100g (20 Kč)
  • vanilkové aroma (lahvička 26 Kč)

ad korpus I – místo kakaa drcené ořechy, pár kapek vanilkového aroma. Cena cca 115 Kč.

Krém I – máslový

  • 500ml mléka (9 Kč)
  • 200g cukru krupice (6 Kč)
  • 60g vanilkového pudinku (většinou 1 a 1/2 sáčku) (2x 16Kč)
  • 1 vejce
  • 2 a 1/4 másla (máslo á 39 Kč)

Máslo nechat povolit, aby mělo pokojovou teplotu. V kastrůlku mléko, pudink, cukr, projít varem. Ve studené lázni vymíchat – dokud to nepálí. Pak postupně zašleháme máslo. Přidal jsem i půl víčka rumu. Dát vychladit do lednice.

Čas: 30minut, cena 135Kč + 50Kč práce – 185 Kč

Krém II – malinové mascarpone

  • 500g mascarpone (2x 40Kč)
  • 200ml 33% smetany (19 Kč)
  • 1 zakysaná smetana (13 Kč)
  • ztužovač šlehačky (8 Kč)
  • 120g cukru (3,12 Kč)
  • 1ks vanilkového cukru (2 Kč)
  • maliny z mrazáku (10 Kč)

Smetanu vyšlehat se ztužovačem, pak vše ostatní smíchat a vymíchat dohladka.

Čas: 30minut, cena 136Kč + 50Kč práce – 186 Kč

Na dort je třeba také potahovací hmota – té bylo čtyřnásobek množství v tomto postu. Cena tedy 4x30Kč + cca 20minut práce – 34Kč – celkem za potahovací hmotu 154Kč

Náklady na dort jsou tedy celkem 735Kč.


falešný marcipán – fondant

Můj první pokus – peču dort. Chtěl jsem potahovat, takže jsem v Makru omylem zakoupil Fondánovou hmotu – od Kovandy. Kyblík 4kg – mají i menší balení. Na kyblíku je napsáno, že pokud z toho má být potahovací hmota, je třeba to smíchat se sušeným mlékem, olejem atd.. Takže jsem zkusil internet, našel pár “recepisů” a interpoloval. Výsledek docela překvapil, na to, že to bylo poprvé :-)

fondant

Ingredience:

  • 100g fondánové hmoty (3.75 Kč)
  • 100g moučkového cukru (s co nejmenší protispékavou složkou) (2.60 Kč)
  • 100g plnotučného (asi se dá i polotučného) sušeného mléka (23 Kč)
  • lžičku oleje (možno nahradit rozpuštěným tukem, např. Omega)
  • lžičku vody
  • lžičku medu
  • mandlové aroma (cca 1/2 lžičky) (lahvička 25 Kč)

Hmotu, cukr a mléko jsem dal do misky, v mikrovlnce prohřál chvilku – hmota se částečně rozpustí. Přidal jsem vše ostatní. Je potřeba si připravit misku s vlažnou vodou, na namáčení rukou. Ingredience mícháme – nebojte se, zůstává to dlouho sypké, je treba to mačkat mezi prsty – asi jako když se dělají bramb. knedlíky. Postupně namáčíme ruce do vody – já namáčel asi 3x – tady pozor – voda se nepřidává – přemokřený “marcipán” nejde nastavit. Je třeba hníst do doby, než hmota bude jednolitá – můžeme si pomoci hnětením na desce, podsypáváme škrobem. Následně do pytlíku, dobře uzavřít. Dá se dobře barvit gelovými barvami – pokud třeba ředit, ředíme alkoholem.

Čas: cca 10minut, cena cca 30 Kč + 17 Kč práce – 47 Kč

MCP7940 – RTC with Pi

As I’m building my own IQ house control system, I need to have RTC in my system. So started playing with MCP7940N and i2c interface. I’m using Raspberry Pi for my experiments with i2c/SPI.

Construction is pretty simple, just use MCP7840N Datasheet.

mcp7940n-schema


Then you can start checking with Pi. In my case, I’m using RevB, so my bus has number 1 and RTC got 0x6f address.

root@pi:~# i2cdetect -y 1
     0  1  2  3  4  5  6  7  8  9  a  b  c  d  e  f
00:          -- -- -- -- -- -- -- -- -- -- -- -- --
10: -- -- -- -- -- -- -- -- -- -- -- -- -- -- -- --
20: -- -- -- -- -- -- -- -- -- -- -- -- -- -- -- --
30: -- -- -- -- -- -- -- -- -- -- -- UU -- -- -- --
40: -- -- -- -- -- -- -- -- -- -- -- -- -- -- -- --
50: -- -- -- -- -- -- -- -- -- -- -- -- -- -- -- --
60: -- -- -- -- -- -- -- -- -- -- -- -- -- -- -- 6f
70: -- -- -- -- -- -- -- --

what next? Check address 0x00, if the onboard oscilator is running

root@pi:~# i2cget -y 1 0x6f 0x00 b
0x00

0x00 means NO, it’s NOT running. So, turn it on

root@pi:~# i2cset -y1 1 0x6f 0x00 0x80

and check few times address 0x00

root@pi:~# i2cget -y 1 0x6f 0x00 b
0x87
root@pi:~# i2cget -y 1 0x6f 0x00 b
0x88
root@pi:~# i2cget -y 1 0x6f 0x00 b
0x89
root@pi:~# i2cget -y 1 0x6f 0x00 b
0x90
root@pi:~# i2cget -y 1 0x6f 0x00 b
0x91

Increments! Great. That means – our oscilator is working = our clock is working too. Next step is to set current time and date. But wait. How are values stored and read/written? RTC uses BCD encoding for values, that means, eg. number 94 is stored as 9 and 4, both in 4 bits = 9 is stored as 1001 and 4 as 0100, in hexadecimal 0x94. Easy? Eg. day is using 6 bits, upper two for 0123 values, bottom bits for 0-9, so 31th will be stored as 0x31. For more details please read the PDF – RTCC Memory map. So back to setting the date & time:

# 2nd Feb 2014
root@pi:~# i2cset -y 1 0x6f 0x06 0x14
root@pi:~# i2cset -y 1 0x6f 0x05 0x02
root@pi:~# i2cset -y 1 0x6f 0x04 0x19
# 00:02:00
root@pi:~# i2cset -y 1 0x6f 0x02 0x00
root@pi:~# i2cset -y 1 0x6f 0x01 0x02
root@pi:~# i2cset -y 1 0x6f 0x01 0x80

Fine. But if we’re setting ’00’ as seconds – address 0x00 – why value 0x80? 7th bit = ST – onboard oscilator enabled.

I’ve written simple Python code to read from RTC and print out the value:

from time import sleep
import smbus
import time
import signal
import sys

bus = smbus.SMBus(1)
RTC_ADDR = 0x6f

ADDR_SEC = 0x00
ADDR_MIN = 0x01
ADDR_HOUR = 0x02

def signal_handler(signal, frame):
  sys.exit(0)

def bcd2bin(x):
  return (((x) & 0x0f) + ((x) >> 4) * 10)

if __name__ == "__main__":
  signal.signal(signal.SIGINT, signal_handler)
  while True:
    sec = bcd2bin(bus.read_byte_data(RTC_ADDR, ADDR_SEC) & 0x7f)
    min = bcd2bin(bus.read_byte_data(RTC_ADDR, ADDR_MIN) & 0x7f)
    hour = bcd2bin(bus.read_byte_data(RTC_ADDR, ADDR_HOUR) & 0x3f)
    print "%02d:%02d:%02d" % (hour, min, sec)
    sleep(0.9) # nearly 1 sec

Just run by

root@pi:~# python rtc.py
00:35:41
00:35:42
00:35:43
00:35:44
00:35:45
00:35:46

Voila! :) RTC is up and running. I’d like to check tomorrow (resp. today) morning, if everything is still working correctly, and can create next module for my IQ house control system :)

capistrano3: run gem binary

I need to setup deploy task to run eye. Tried to deal with gem-wrappers, but had no success. As capistrano3 is using non-interactive ssh, without loading user’s environment (.profile, .bashrc etc), then command, which is not in PATH, it’s not workin.

So, after searching and reading capistrano (capistrano/rvm) source, then sshkit source, I got into this simple solution.

It’s not dependent on any other settings nor knowing what, where rvm is installed.

before change in deploy.rb (not working)

 INFO [57a66442] Running /usr/bin/env eye info on example.com
DEBUG [46484690] Command: cd /home/deploy/app/releases/20140130214109 && ( /usr/bin/env eye info )
DEBUG [46484690] 	/usr/bin/env: eye
DEBUG [46484690] 	: No such file or directory

after change in deploy.rb

 INFO [a2f9c75f] Running /usr/local/rvm/bin/rvm default do eye info on example.com
set :rvm_remap_bins, %w{eye}

namespace :settings do
  task :prefix_rake do
    fetch(:rvm_remap_bins).each do |cmd|
      SSHKit.config.command_map[cmd.to_sym] = "#{SSHKit.config.command_map[:gem].gsub(/gem$/,'')} #{cmd}"
    end
  end
end

after 'rvm:hook', 'settings:prefix_rake'

original code from capistrano is

# https://github.com/capistrano/rvm/blob/master/lib/capistrano/tasks/rvm.rake
SSHKit.config.command_map[:rvm] = "#{fetch(:rvm_path)}/bin/rvm"

rvm_prefix = "#{fetch(:rvm_path)}/bin/rvm #{fetch(:rvm_ruby_version)} do"
fetch(:rvm_map_bins).each do |command|
  SSHKit.config.command_map.prefix[command.to_sym].unshift(rvm_prefix)
end

...
set :rvm_map_bins, %w{gem rake ruby bundle}

Index? Yes, please

When altering some tables, I got into optimization adding indexes.

I have one table – users

mysql> select count(1) from users;
+----------+
| count(1) |
+----------+
|   389900 |
+----------+
1 row in set (0.08 sec)

and doing one query:

mysql> SELECT COUNT(*) FROM `users`  WHERE (last_active_at > '2014-01-07 00:17:42') AND (last_logoff <> last_active_at or last_logoff is null);
+----------+
| COUNT(*) |
+----------+
|      913 |
+----------+
1 row in set (0.23 sec)

and slow-log complains

# Schema: test  Last_errno: 0  Killed: 0
# Query_time: 0.365658  Lock_time: 0.000060  Rows_sent: 1  Rows_examined: 389894  Rows_affected: 0
# Bytes_sent: 65
SET timestamp=1389055417;
SELECT COUNT(*) FROM `users`  WHERE (last_active_at > '2014-01-07 00:23:36') AND (last_logoff <> last_active_at or last_logoff is null);

from his you can see it did full table scan (Rows_examined: 389894) which is kinda wrong.

so, let’s explain

mysql> explain SELECT COUNT(*) FROM `users`  WHERE (last_active_at > '2014-01-07 00:17:42') AND (last_logoff <> last_active_at or last_logoff is null);
+----+-------------+-------+------+---------------+------+---------+------+--------+-------------+
| id | select_type | table | type | possible_keys | key  | key_len | ref  | rows   | Extra       |
+----+-------------+-------+------+---------------+------+---------+------+--------+-------------+
|  1 | SIMPLE      | users | ALL  | NULL          | NULL | NULL    | NULL | 385645 | Using where |
+----+-------------+-------+------+---------------+------+---------+------+--------+-------------+
1 row in set (0.00 sec)

Hmm, “type” shows no index has been used and ALL table scanned. WRONG

Let’s add an index – we have two fields, last_active_at and last_logoff, let’s try with last_logoff only

mysql> alter table users add index ix_last_logoff (last_logoff);
Query OK, 0 rows affected (2.16 sec)
mysql> explain SELECT COUNT(*) FROM `users`  WHERE (last_active_at > '2014-01-07 00:17:42') AND (last_logoff <> last_active_at or last_logoff is null);
+----+-------------+-------+------+----------------+------+---------+------+--------+-------------+
| id | select_type | table | type | possible_keys  | key  | key_len | ref  | rows   | Extra       |
+----+-------------+-------+------+----------------+------+---------+------+--------+-------------+
|  1 | SIMPLE      | users | ALL  | ix_last_logoff | NULL | NULL    | NULL | 385646 | Using where |
+----+-------------+-------+------+----------------+------+---------+------+--------+-------------+
1 row in set (0.00 sec)

hmm, still using full table scan. Let’s drop and create combined index

mysql> alter table users drop index ix_last_logoff;
Query OK, 0 rows affected (1.40 sec)
Records: 0  Duplicates: 0  Warnings: 0

mysql> alter table users add index ix_last_logoff (last_logoff, last_active_at);
Query OK, 0 rows affected (2.20 sec)
Records: 0  Duplicates: 0  Warnings: 0

and what our explain friend shows now?

mysql> explain SELECT COUNT(*) FROM `users`  WHERE (last_active_at > '2014-01-07 00:17:42') AND (last_logoff <> last_active_at or last_logoff is null);
+----+-------------+-------+-------+----------------+----------------+---------+------+--------+--------------------------+
| id | select_type | table | type  | possible_keys  | key            | key_len | ref  | rows   | Extra                    |
+----+-------------+-------+-------+----------------+----------------+---------+------+--------+--------------------------+
|  1 | SIMPLE      | users | index | ix_last_logoff | ix_last_logoff | 12      | NULL | 385646 | Using where; Using index |
+----+-------------+-------+-------+----------------+----------------+---------+------+--------+--------------------------+
1 row in set (0.00 sec)
mysql> SELECT COUNT(*) FROM `users`  WHERE (last_active_at > '2014-01-07 00:17:42') AND (last_logoff <> last_active_at or last_logoff is null);
+----------+
| COUNT(*) |
+----------+
|      913 |
+----------+
1 row in set (0.23 sec)

Oops. Explain shows it’s using index (bit better than ALL), but still fetches 385646 rows. Still wrong. Let’s switch columns in index.

mysql> alter table users drop index ix_last_logoff;
Query OK, 0 rows affected (3.95 sec)
Records: 0  Duplicates: 0  Warnings: 0

mysql> alter table users add index ix_last_logoff (last_active_at, last_logoff);                                                         
Query OK, 0 rows affected (3.81 sec)
Records: 0  Duplicates: 0  Warnings: 0

What explain says now?

mysql> explain SELECT COUNT(*) FROM `users`  WHERE (last_active_at > '2014-01-07 00:17:42') AND (last_logoff <> last_active_at or last_logoff is null);
+----+-------------+-------+-------+----------------+----------------+---------+------+------+--------------------------+
| id | select_type | table | type  | possible_keys  | key            | key_len | ref  | rows | Extra                    |
+----+-------------+-------+-------+----------------+----------------+---------+------+------+--------------------------+
|  1 | SIMPLE      | users | range | ix_last_logoff | ix_last_logoff | 6       | NULL |  963 | Using where; Using index |
+----+-------------+-------+-------+----------------+----------------+---------+------+------+--------------------------+
1 row in set (0.00 sec)

Great! and select?

mysql> SELECT COUNT(*) FROM `users`  WHERE (last_active_at > '2014-01-07 00:17:42') AND (last_logoff <> last_active_at or last_logoff is null);
+----------+
| COUNT(*) |
+----------+
|      924 |
+----------+
1 row in set (0.00 sec)

0.20secs improvement.

Explanation? It’s simple. last_active_at is doing range scan against a value and against second column, thus first referenced. If last_logoff is first in combined index, it can’t be used for last_active_at > part of the query.

redis sentinel with ruby (on rails)

In the last article I introduced how to install and use redis sentinel. As I’m using ruby, I need to use this new redis configuration with ruby (on rails).

For ruby on rails use redis-sentinel gem.

Then your redis initializer will look like

sentinels = [
  { host: '10.0.0.1', port: 17700 },
  { host: '10.0.0.2', port: 17700 },
  { host: '10.0.0.3', port: 17700 },
  { host: '10.0.0.4', port: 17700 }
]
# redis master name from sentinel.conf is 'master'
Redis.current = Redis.new(master_name: 'master', sentinels: sentinels)

You can use your redis then as usual.

When using sidekiq, configuration is pretty simple too

require 'sidekiq/web'
require 'redis-sentinel'
require 'sidetiq/web'

rails_root = ENV['RAILS_ROOT'] || File.dirname(__FILE__) + '/../..'
rails_env = ENV['RAILS_ENV'] || 'development'

sentinels = [
  { host: '10.0.0.1', port: 17700 },
  { host: '10.0.0.2', port: 17700 },
  { host: '10.0.0.3', port: 17700 },
  { host: '10.0.0.4', port: 17700 }
]

redis_conn = proc { 
  Redis.current = Redis.new(master_name: 'master', sentinels: sentinels) 
}
redis = ConnectionPool.new(size: 10, &redis_conn)

Sidekiq.configure_server do |config|
  config.redis = redis
end

Sidekiq.configure_client do |config|
  config.redis = redis
end

You can test your configuration. Run rails console and test with

Loading production environment (Rails 3.2.16)
1.9.3p448 :001 > Redis.current.keys("*").count
 => 746
1.9.3p448 :002 > Redis.current
 => #<Redis client v3.0.5 for redis://10.0.0.2:6379/0>

if you see “127.0.0.1:6379”, something is probably wrong. Then try to set/get some key and check Redis.current once again.

redis sentinel setup

Prerequisities

  • multiple clients with redis 2.8.2+ installed

Do I need sentinel? If you want to have some kind of redis failover (there’s no cluster yet) – yes. Sentinels continuously monitor every redis instance and change configuration of given redis node(s) – if specified number of sentinels decided whether master is down, then they elect and promote new master and set other nodes as a slave of this master.

Looks interesting? Yes. It is. But. There’s a little time gap between electing and switching to the new master. You have to resolve this on application level.

Basically. Initial setup expects all nodes running as a master, with manual set slaveof ip port in redis-cli on meaned redis slaves. Then run sentinel and it does the rest.

sample redis configururation files follow:

daemonize yes
pidfile /usr/local/var/run/redis-master.pid
port 6379
bind 10.0.0.1
timeout 0
loglevel notice
logfile /opt/redis/redis.log
databases 1
save 900 1
save 300 10
save 60 10000
stop-writes-on-bgsave-error yes
rdbcompression yes
rdbchecksum yes
dbfilename master.rdb

dir /usr/local/var/db/redis/
slave-serve-stale-data yes
slave-read-only no
slave-priority 100
maxclients 2048
maxmemory 256mb

# act as binary log with transactions
appendonly yes

appendfsync everysec
no-appendfsync-on-rewrite no
auto-aof-rewrite-percentage 100
auto-aof-rewrite-min-size 64mb
lua-time-limit 5000
slowlog-log-slower-than 10000
slowlog-max-len 128
hash-max-ziplist-entries 512
hash-max-ziplist-value 64
list-max-ziplist-entries 512
list-max-ziplist-value 64
set-max-intset-entries 512
zset-max-ziplist-entries 128
zset-max-ziplist-value 64
activerehashing yes

client-output-buffer-limit normal 0 0 0
client-output-buffer-limit slave 256mb 64mb 60
client-output-buffer-limit pubsub 32mb 8mb 60

and sentinel configuration file:

port 17700
daemonize yes
logfile "/opt/redis/sentinel.log"

sentinel monitor master 10.0.0.1 6379 2
sentinel down-after-milliseconds master 4000
sentinel failover-timeout master 180000
sentinel parallel-syncs master 4

Start all of your redis nodes with redis config and choose master. Then run redis console and set all other nodes as a slave of given master, using command slaveof 10.0.0.1 6379. Then you can connect to your master and verify, if there are all of your slave nodes, connected and syncing – run info command in your master redis console. Output should show you something like this

- snip -

# Replication
role:master
connected_slaves:3
slave0:ip=10.0.0.2,port=6379,state=online,offset=17367254333,lag=1
slave1:ip=10.0.0.3,port=6379,state=online,offset=17367242971,lag=1
slave2:ip=10.0.0.4,port=6379,state=online,offset=17367222381,lag=1

- snip-

To test, if your sentinel works, just shutdown your redis master and watch sentinel log. You should see something like this

[17240] 04 Dec 07:56:16.289 # +sdown master master 10.24.37.144 6379
[17240] 04 Dec 07:56:16.551 # +new-epoch 1386165365
[17240] 04 Dec 07:56:16.551 # +vote-for-leader 185301a20bdfdf1d5316f95bae0fe1eb544edc58 1386165365
[17240] 04 Dec 07:56:17.442 # +odown master master 10.0.0.1 6379 #quorum 4/2
[17240] 04 Dec 07:56:18.489 # +switch-master master 10.0.0.1 6379 10.0.0.2 6379
[17240] 04 Dec 07:56:18.489 * +slave slave 10.0.0.3:6379 10.0.0.3 6379 @ master 10.0.0.2 6379
[17240] 04 Dec 07:56:18.490 * +slave slave 10.0.0.4:6379 10.0.0.4 6379 @ master 10.0.0.2 6379
[17240] 04 Dec 07:56:28.680 * +convert-to-slave slave 10.0.0.1:6379 10.0.0.1 6379 @ master 10.0.0.2 6379

explained line by line

+sdown master master 10.24.37.144 6379

master is subjectively down (maybe)

+odown master master 10.0.0.1 6379 #quorum 4/2

master is objectively down (oh, really), two of four sentinels have the same opinion

+switch-master master 10.0.0.1 6379 10.0.0.2 6379

so we switch to another master – chosen 10.0.0.2

+slave slave 10.0.0.3:6379 10.0.0.3 6379 @ master 10.0.0.2 6379

reconfigure 10.0.0.3 as a slave of new master 10.0.0.2

+convert-to-slave slave 10.0.0.1:6379 10.0.0.1 6379 @ master 10.0.0.2 6379

sorry, former master, you have to serve as a slave now

+sdown, -odown? + means ‘is’, – means ‘is no longer’. Then “+sdown” can be translated as “is subjectively down” and “-odown” like “is no longer objectively down”. Simple, huh? :)

PS: take my configuration files as a sample. Feel free to modify to match your need and check redis/sentinel configuration docs to get deeper knowledge about configuration options.